You use this program to maintain a log file of all programs that have been accessed by operators.
The log file stores information about the program accessed, the date and time it was accessed, the length of time it was in use, the operator who loaded the program and the computer name from which the program was run. It also stores information of processes that were ended using the Admin Display Users Logged in Detail program (indicated in the Message column of the listview pane) and fatal RTS (Run Time System) errors.
You can use the Admin System Audit program to track changes or events in SYSPRO that affect system security.
| Field | Description |
|---|---|
| Options | |
| Show all records | Select this to display all the job logging records in the Log Details pane. |
| Record limit | Enter the maximum number of records to be displayed in the Log Details pane. |
| Functions | |
| Set purge flag | Select this to indicate that the selected line is ready to be purged. The purge status in the Ready to purge column against the selected line is changed to Yes. |
| Clear purge flag | Select this to change the purge status from Yes to No. |
| Purge | Select this to delete the selected job logging transactions. The Admin Job Logging Purge program is used to purge the transactions. |
| Time filter | Select the time period for which you want to display the job logging transactions. |
| Refresh View | Select this to refresh the log details within the listview pane. |
| Show detail | Select this to view detail messages for a program which
is currently running. Only a limited number of programs make use of this facility. For example, viewing details for SO Entry displays the register number and invoice number while an online invoice is being processed. |
| Show Custom Filter | Select this to open the Filter Options pane. |
This screen is displayed when you select the Show Customer Filter option on the toolbar.
| Field | Description | ||||||||||||||
|---|---|---|---|---|---|---|---|---|---|---|---|---|---|---|---|
| Apply Custom Filter | Select this to apply your selections to the records in the Log Details pane. | ||||||||||||||
| Reset | Select this to clear any selections you made and to reset all Filter Options to their defaults. | ||||||||||||||
| Log date selection | This enables you to indicate the log dates for which you want to display transactions. | ||||||||||||||
| Date filter type |
|
||||||||||||||
| Start date | Indicate the start date or single date from which you want to display job log details in the listview. | ||||||||||||||
| End date | Indicate the end date up to which you want to display job log details in the listview. | ||||||||||||||
| Log time selection | |||||||||||||||
| Time filter type |
|
||||||||||||||
| Start time | Enter the start time or active at time for which you want to display job log details in the listview. | ||||||||||||||
| End time | Enter the end time for which you want to display job log details in the listview. | ||||||||||||||
| Operator selection | Indicate the operator for whom you want to display transactions. | ||||||||||||||
| Operator filter type |
|
||||||||||||||
| Start operator | Select the first operator in the range, or a single operator. | ||||||||||||||
| End operator | Select the last operator in the range. | ||||||||||||||
| Operator list | Select the relevant operators from the list of operators. | ||||||||||||||
| Program selection | Indicate the programs for which you want to display transactions. | ||||||||||||||
| Program filter type |
|
||||||||||||||
| Program | Select the individual program. | ||||||||||||||
| Program list | Select the relevant programs from the list of programs. | ||||||||||||||
| Status selection | |||||||||||||||
| Status filter |
|
||||||||||||||
| File errors | Select this to display all records where a file status message was encountered (e.g. indexed file corrupted, kernel problem, or corrupt index file). | ||||||||||||||
| Active | Select this to display all records that are still deemed active (i.e. records where no log off date has been recorded). | ||||||||||||||
| Remarks | Select this to display all records that have a remark status (i.e. where the system terminated abnormally). Details are displayed in the message column. | ||||||||||||||
| Blank status | Select this to display all records that have no status. | ||||||||||||||
| Transaction selection |
|
||||||||||||||
| Transaction filter |
|
||||||||||||||
| Column | Description |
|---|---|
| Logon date | Indicates the date and time the operator commenced the transaction. |
| Logoff date |
Indicates the date and time the operator terminated the transaction. |
| Run time | Indicates the time the transaction took to complete. |
| Program | Indicates the code of the program used for the transaction. |
| Program name | Indicates the name for the Program code used for the transaction. |
| Operator | Indicates the operator code. |
| Operator group | Indicates the primary group to which the operator belongs. |
| NT PID | Indicates the process ID. |
| SPID | Indicates the SQL session process ID. |
| Computer name | Indicates the name of the computer that caused the entry to be logged. |
| Program version |
Indicates the version of the SYSPRO program used at the time the entry was recorded. This is the version of the program that was called last. A program may be called and in turn call other programs to perform various functions. If the program closes prematurely, the version of the last called program is stored in memory and is subsequently reported against the calling program. If you suspect that a client machine is out of date, you can delete the VERGUI.TXT file on the client machine to force self-healing. |
-
You must enable the Job logging required option in the Company Maintenance program to maintain a log file of all programs accessed by operators,
-
You must enable the Job logging for business objects option in the Company Maintenance program to include job logging entries for business objects in the job log file. Job logging entries are not created when running any SRS reports.
Each time you load a program in SYSPRO, a job log entry is created with a start time. When you exit the program, the end time is recorded against the original job log entry. A program without an end time means that either the operator is currently using the program, or the process has crashed, or the process has been killed. There is no way of distinguishing between these two possibilities.
If a program has not terminated correctly and was started before today, then the system assumes it is no longer running and it displays the program as Failed in the Logoff date column and the run time is displayed as spaces.
In a client/server environment, a crash on the client usually leads to the server process detecting this 'disconnection' and outputs a client/server log record. The Admin Diagnostics - C-S Failure Analysis program can be used to merge the job logging and client/server log file to see what occurred on the system.
You can also use the Admin Display Users Logged in Detail program to list all processes running on the server. This program uses the User file to match the process id's to the operators actually using the system. If the system detects a Windows PID that does not have a User file entry, then it is marked as an 'unknown' process and can be terminated.
The IMPEXT program prevents the machine from shutting down while SYSPRO is open in a posting program. When a Windows shutdown is attempted while SYSPRO is still running, details of the SYSPRO program being run at the time will be displayed.
A Failed transaction is displayed in the job logging when the operator forces a Windows shutdown as this prevents the program from closing gracefully.
Application Help Panes provide step-by-step instructions for various functions within the program, including a brief overview of what the program does, what setup options are required and how to personalize the program. The intention is that the pane provides information that is uncluttered and easy to navigate.
You can embed an Application Help Pane:
-
in the main SYSPRO menu
-
in any program with panes, if not using roles
-
when adding a role layout in Design Mode.
Inserting Application Help
You would typically follow this procedure to display help for the current program in a customized pane that can be pinned to the program window.
Information includes step-by-step instructions for the various functions available within the program, including a brief overview of what the program does, what setup options are required and how to personalize the program.
-
Open the program for which you want to insert application help into a customized pane.
This functionality is only available for a program that has panes.
-
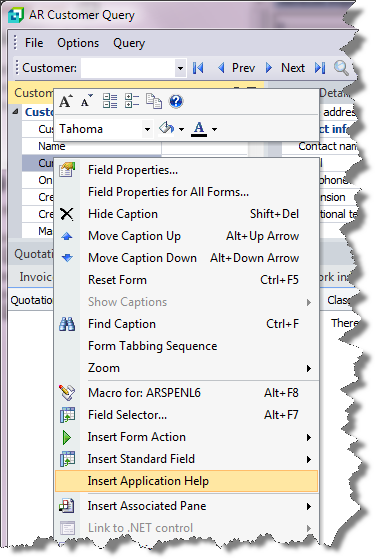
Right-click any form field.
You can also click the triangle menu icon that appears in the title area of a pane.
-
Select Insert Application Help from the context-sensitive menu.
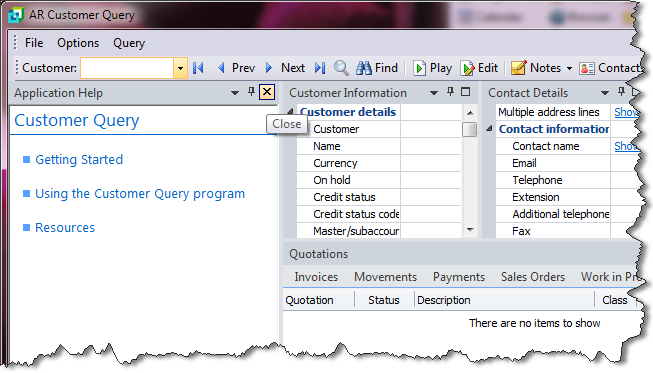
The application help appears in a pane within your program. You can reposition the pane using the docking stickers or pin it to the program window.
Removing the Application Help pane
If you no longer want to display application help in a pane for your current program, you can simply remove it.
-
Select the Close icon in the right-hand corner of the application help pane.
-
Confirm that you want to delete the pane.
![[Note]](images/note.png)

