You use this program to view month-to-date and year-to-date sales information held against your salespersons and product classes.
This program can be run at any time.
If you are new to this query, then the following information will help you achieve the best results:
- The information shown is up to date as at the last time the Sales Analysis Update program was run.
-
If you know the branch code, then you can enter it directly and press the tab key to view the information.
If you do not know the branch code, then you can use the browse function to locate the branch.
-
You can personalize this query in a number of ways. These include:
- configuring property sheets (e.g. the section headed Sales Value for Current Month). This includes being able to sequence items by dragging them up or down, to show important items first
- configuring the Sales Value for Last 12 Periods listview. This includes being able to sequence columns by dragging them left or right, sorting columns and changing column widths
- configuring the layout of the panes on the screen, including hiding or displaying panes
-
customising the graph
- Toolbar and menu
- Sales Values/Quantities for Last 12/13 Periods
- Sales vs Budgets Graph
- Sales Analysis Query Details
- Notes and warnings
| Field | Description | ||||
|---|---|---|---|---|---|
| Branch | Indicate the branch against which you want to perform the query. | ||||
| Query selection | |||||
| Product Class |
Select this to indicate the product class against which you want to perform the query. The Sales Analysis Query program uses the budgets defined against the product classes to compare sales values and quantities. If you want to compare sales values to sales targets, then you need to use the Sales Target Reports program. Month-to-date and Year-to-date product class sales values are displayed against the following fields:
|
||||
| Salesperson |
Select this to indicate the salesperson against which you want to perform the query. Month-to-date and Year-to-date salesperson sales values are displayed against the following fields:
|
||||
| Product class | Enter the product class, within the branch selected, for which you want to view the information. | ||||
| Salesperson | Enter the salesperson, within the branch selected, for whom you want to view the information. | ||||
This displays a comparison of budgeted sales values to actual sales made over the last 12 periods.
If your number of accounting periods per year is set to 13 (Company Maintenance) then this function is displayed as Sales Value Last 13 Periods.
This displays a graphical representation of the data held against the salesperson or product class.
Depending on your selection at the option: Budgets represent (Sales Analysis Setup), the comparison between sales and budgets is displayed either by quantity or by value.
| Column | Description |
|---|---|
| Order branch |
This indicates the branch for which the information is being displayed. This is the branch entered at the Branch field above. You can select this field to use the Browse on AR Branches program to view branch information. |
| Salesperson |
This indicates the salesperson for which the information is being displayed. This is only displayed if you selected to view the information by salesperson. You can select this field to use the Browse on Salespersons program to view branch information. |
| Product class |
This indicates the product class for which the information is being displayed. This is only displayed if you selected to view the information by product class. You can select this field to use the Browse on Product Classes program to view product class information. |
-
The figures displayed in this query represent either quantities or values, depending on your selection at the option: Budgets represent (Sales Analysis Setup - General tab).
The Sales Analysis figures are held in a single set of buckets. These buckets can represent either values or quantities. Therefore, when you change the option Budgets represent (Sales Analysis Setup - General tab), from Quantity to Value, or vice versa, when sales analysis history already exists, the historical information is not changed. The change only takes effect from the time the option was changed. You will therefore have a mix of quantities and values displayed in the Sales Analysis Query as this is how the figures are held in the single set of Sales Analysis buckets.
Inserting Application Help
You would typically follow this procedure to display help for the current program in a customized pane that can be pinned to the program window.
Information includes step-by-step instructions for the various functions available within the program, including a brief overview of what the program does, what setup options are required and how to personalize the program.
-
Open the program for which you want to insert application help into a customized pane.
This functionality is only available for a program that has panes.
-
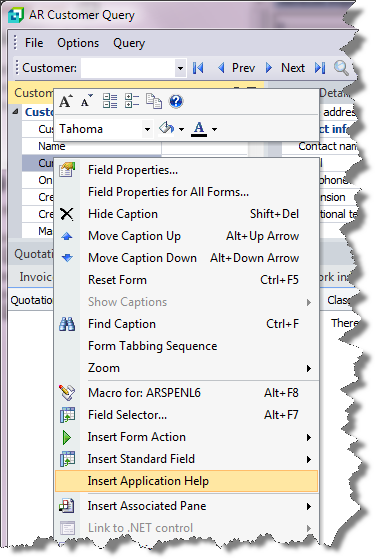
Right-click any form field.
You can also click the triangle menu icon that appears in the title area of a pane.
-
Select Insert Application Help from the context-sensitive menu.
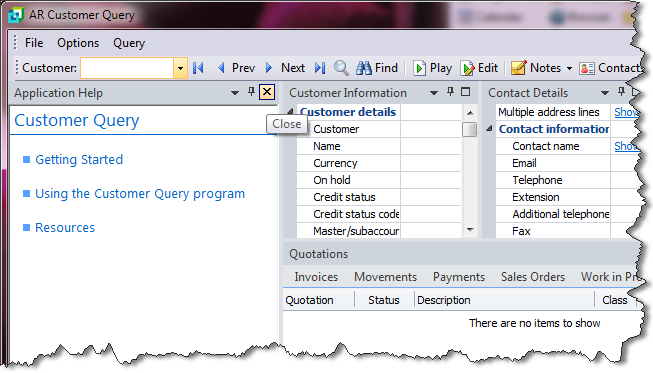
The application help appears in a pane within your program. You can reposition the pane using the docking stickers or pin it to the program window.
Removing the Application Help pane
If you no longer want to display application help in a pane for your current program, you can simply remove it.
-
Select the Close icon in the right-hand corner of the application help pane.
-
Confirm that you want to delete the pane.
![[Note]](images/note.png)

