This program helps you detect problems on a SYSPRO client machine and on your application server. Detected problems are displayed in a grid view, with appropriate icons indicating the severity.
As the System Administrator, you can decide when checks must be performed on client machines as well as configure the system to fix some of the problems automatically (e.g. an incorrect BASEDIR registry setting on the client).
Checks on the client machine are performed using the VBScript file: diagnostics.vbs (located in the \Base\Samples folder). The script is copied to the \Work\Vbscripts folder automatically when you launch the Diagnostics Manager program.
Checks on the application server are automatically performed each time you load the Diagnostics Manager program.
- Toolbar and menu
- Configuration
- Application Server Checks
- e.net Transaction Log
- e.net Comstate Log
- Client Computers
- Program Usage
- Show Events Window
| Field | Description |
|---|---|
| Close | Select this to exit the program. |
| Save and Exit | Select this to save the Configuration options you selected and exit the program. When next you load the program, your configuration settings are retained. |
| Refresh | Select this to redisplay the information based on any changes you made to the Configuration options. |
| Diagnostic VBScript | Select this to open the VBScript Editor.
You typically use this to enhance the diagnostics script to add your own client-side checks. This does not affect the standard diagnostics.vbs script included with the product. Using the VBScript Editor program, create a VBScript module named UserDiagnostics.vbs and include your code. To see an example of how to do this, select the Diagnostics VBScript button on the toolbar and view the comments against the diagnostics script in the VBScript Editor program to see how to create your modular code. |
| Run Local Diagnostics | Select this to run diagnostic checks on your local workstation. This does not increment the version check number and does not automatically correct any problems. |
| Field | Description | ||||
|---|---|---|---|---|---|
| Run check for all client machines | Enable this option to run a diagnostic check against
all client machines when next an operator logs on to SYSPRO
and loads the Diagnostics Manager program.
|
||||
| Version check number | This field is incremented by 1 each time you enable the Run a check for all client machines option. It is not incremented if you select to run the check on a local machine only (i.e. when using the Run Local Diagnostics function). | ||||
| Auto correct problems | Select this to allow the system to attempt to fix
problems automatically.
|
||||
| Send notification email to | Enter one or more email addresses (separated by
semicolons) to which you want to send the results of the
diagnostic checks.
|
||||
| Notify user at logon | Enable this option if (at login time) you want to notify the operator of any errors detected on the client workstation. | ||||
| Verify client components | Enable this option if you want to check for missing components or programs for SYSPRO applications on each client machine. If there are missing components and the Auto correct problems option is enabled, then all screensets on the client machine are removed to initiate the self-healing process. | ||||
The Application Server Checks pane displays diagnostic messages regarding the application server. These include:
- Installed port checks (i.e. missing SYSPRO port files) - see SYSPRO Installed Updates Query.
- Database in use (i.e. the version of SQL Server installed).
- Warning messages (e.g. when the file size of specific files exceeds a specific size, or when required environment variables are missing or incorrect).
Refer to Diagnostic Checks for additional information on the server checks performed.
The e.net Transaction Log pane displays a log of all the e.net transactions generated by business objects, when the Diagnostics option in the System Setup program is set to enet01. This can be useful in indicating which business objects were executed and whether any failed.
| Field | Description | ||||
|---|---|---|---|---|---|
| Refresh | Select this to redisplay all data in the listview. You typically select this option after searching for and displaying specific entries only. | ||||
| Delete | Select this to delete the transaction log file. This
removes all entries in the entlog.dat and
enetlog.idx files, but does not remove
the files themselves. You can manually delete these files if
they are no longer required. The files are, however,
re-created when the first e.net Solutions transaction is
executed.
|
||||
| Select this to print the contents of the listview. | |||||
| Export to Excel | Select this icon to export the contents of the listview to an Excel spreadsheet. | ||||
| Search text | You use this field to enter specific text you want to locate within the listview. For example, an operator code. | ||||
| Clear | Select this to clear the Search text field. | ||||
The e.net Comstate Log pane displays a list of all active e.net sessions (i.e. all the operators currently logged in to e.net Solutions).
Similar functions can be performed on this listview as on the e.net Transaction Log listview.
The Client Computers pane displays general information regarding the client workstations as well as details of the problems detected by the Diagnostics Manager program.
| Field | Description |
|---|---|
| Network name | Select this to display the Client Details window which displays details of the checks performed by the Diagnostics Manager program on the specific client workstation. Refer to Diagnostic Checks for additional information on these checks |
| e.net Basedir | This indicates whether a valid e.net Basedir entry exists in the Windows registry. |
| Description | The Remove hyperlink displayed in this column against each client machine, enables you to delete the XML diagnostics file for the client machine. |
The Program Usage pane displays a count of all programs launched from the main menu by all operators. This information is stored in the usage.dat file which is located in the \Base\Settings\Diagnostics folder on the application server.
Administrators and Support personnel can use this information to understand the impact, or importance, of applications used in an organization.
| Field | Description |
|---|---|
| Refresh | Select this to redisplay all data in the listview. You typically select this option after searching for and displaying specific entries only. |
| Select this to print the contents of the listview. | |
| Export to Excel | Select this icon to export the contents of the listview to an Excel spreadsheet. |
| Search text | You use this field to enter specific text you want to locate within the listview (e.g. a program name or description). |
| Clear | Select this to clear the Search text field. |
The Show Events Window function can be selected from the SYSPRO Desktop (->->).
![[Note]](images/note.png)
|
|
|
This function traces all application events that occur in the normal running of SYSPRO and outputs a file (operator_dev02_debug.txt) to the settings\operator folder on the client machine (where operator indicates the operator code). You can send the debug file to SYSPRO for analysis to help troubleshoot problems. |
|
The Events and Messages program launches when you select this function and is a floating pane that is used to display a listview log of when events are fired and messages sent.
You can only close the Events and Messages screen when you are at the SYSPRO Main Menu and not while you have another program open.
| Field | Description |
|---|---|
| Stop |
When the program is loaded it is always in recording mode, and the Stop/Start button will display Stop. Clicking on the Stop button will stop the recording and toggle the Stop/ button. Typically you would stop the recording until you have called up the program to be tracked, and you are ready to start tracking the events. Then you would start recording. |
| Clear |
Clears out the contents of the listview. You do not need to stop recording to clear out the listview, as soon as another VBScript event fires it will be recorded as the first entry in the listview. |
| Options |
Each time that the Events and Messages program is loaded, all of the different types of events and messages are set to be tracked. The message and event types available to display are:
|
| Filter Program |
If you are only interested in recording events from a particular program, you can enter the six character program name against the Filter program prompt, and only events belonging to this program will be recorded. |
| Clear Filter |
Clears the program filter. |
Inserting Application Help
You would typically follow this procedure to display help for the current program in a customized pane that can be pinned to the program window.
Information includes step-by-step instructions for the various functions available within the program, including a brief overview of what the program does, what setup options are required and how to personalize the program.
-
Open the program for which you want to insert application help into a customized pane.
This functionality is only available for a program that has panes.
-
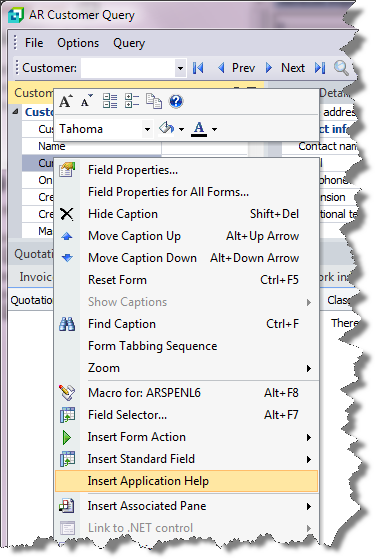
Right-click any form field.
You can also click the triangle menu icon that appears in the title area of a pane.
-
Select Insert Application Help from the context-sensitive menu.
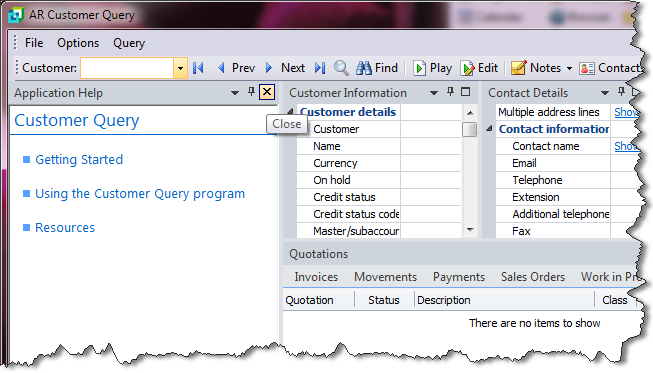
The application help appears in a pane within your program. You can reposition the pane using the docking stickers or pin it to the program window.
Removing the Application Help pane
If you no longer want to display application help in a pane for your current program, you can simply remove it.
-
Select the Close icon in the right-hand corner of the application help pane.
-
Confirm that you want to delete the pane.

